Hieu Trung Le1,†, Nam Tri Vo1,†, Tan Huynh1, and Hoang Duc Nguyen1
Abstract
In recent years, the gene optimization has been widely applied in many fields such as medicine, industry and agriculture. The nucleotide components of original gene are transformed in order to optimize the ability to express target protein. Optimization program must capture the structural trend of the Highly Expressed Genes (HEG), thereby optimizing gene in the appropriate direction. In this study, we analyzed deeply into every characteristic of HEG and compared to the low and middle expressed genes (non-HEG) in Escherichia coli K12. Results showed that the codon usage and GC content of the HEG are more stable than those of non-HEG. The structures, which destabilize the mRNA, restrict transcription and translation such as Shine-Dalgarno sequences, Polynucleotide, Polycodon, mRNA secondary structures and repeated sequences are limited in HEG. These results can be applied to construct gene optimization program.
Introduction
Gene optimization is a genetic technique that increases expression level of genes through increasing its efficiency transcription and translation (1). In principle, gene optimization is a process that replaces codons in native genes to gain new sequences that carry Highly Expressed Genes (HEG) features. HEG was predicted and announced on the Highly Expressed Genes Database (HEG-DB) in 2008 by Puigbo et al. (2). This has provided a useful data for researches on either gene expression or gene optimization.
Characteristics of target genes will affect (increase or decrease) gene expression level. Codon usage is one of the most importance criteria of gene optimization. Each amino acid may be encoded by more than one codons and each organism has its own bias in the use of the 61 available codons. The intracellular tRNA populations are correlated to the codon bias of the mRNA population (3). Highly expressed genes tend to contain codons for which the cell has high abundant tRNA whereas genes that are expressed at low levels tend to include rare codons. GC content of target genes also affects its product amount. The closer GC content of gene to desire value of expression organism is, the higher expression level is. The existences of special structures such as Shine-Dalgarno sequences, polynucleotide, polycodon, mRNA secondary structures and repeat sequences will decrease expression level by affecting transcription and translation efficiencies. The presence of hidden stop codons also affects protein amount but in a distinct way by blocking frame shift translations (4). In this study, we carried out the analysis and comparison on these gene optimization criteria of HEG and non-HEG of Escherichia coli K12 – microorganisms are commonly used in the productions of both prokaryotic and eukaryotic recombinant proteins (5).
Materials and Methods
Micro-organism
The analysis was carried out on genome of Escherichia coli str. K-12 substr. W3110 with accession number NC_007779.1.
HEG and non-HEG
E. coli HEG was obtained from the HEG-DB - a database of predicted highly expressed genes of prokaryotic genomes (2).
E. coli non-HEG was obtained by eliminating the HEG from E. coli K12 genome (from NCBI database).
Criteria analysis
Codon usage
The wc variable was used to evaluate the frequency of usage of a codon that was calculated using the formula:

In which,
wc: Relative Codon Adaptation of codon a
Ca: The codons that codes for amino acid a
Oc: The number of codon c, which code for acid amine a
maxOc: The number of codon have the largest that code for amino acid a
GC content (%GC)
The average GC content of each group genes were analyzed according to the formula:
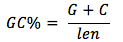
In which, len is length of gene.
Shine Dalgarno (SD)
We calculated the frequency of occurrence of SD on genes according to the formula:
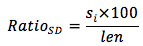
In which,
RatioSD: the frequency of occurrence of homologous sequences to the consensus sequence of SD
si: the number of homologous sequences to the consensus sequence of SD with the mismatch is i (from 0 to 2)
len: the length of gene
Hidden stop codons (HSCs)
The frequency of occurrence of HSC was calculated using the formula below:
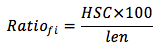
In which,
Ratiofi: the frequency of occurrence of HSC in ith frame
HSC: the number of HSC
len: the length of gene
Repeated sequence (RS)
We analyzed RS with different repetition length (from 6 to 11 and greater than 11) then calculated the frequency of occurrence of the RS with this formula:
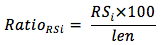
In which,
RatioRSi: the frequency of occurrence of RS with repeat level i
RSi: the number of RS with repeat level i
len: the length of gene
Polynucleotide (PN)
The frequency of occurrence of PN was statistical analyzed with length from 4 to 8 according to the following formula:
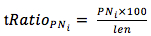
In which,
RatioPNi: the frequency of occurrence of PN with the repeat level i
PNi: the number of PN with repeat level i
len: the length of gene
Polycodon (PC)
The frequency of occurrence of PC was statistically analyzed motif in which a codon repeated from 2 to 5 times according to the following formula:
In which,
RatioPCi: the frequency of occurrence of PC with times of repeat is i
PCi: the number of PC with repeat level i
len: the length of gene
mRNA secondary structure (SS)
The mRNA secondary structure was evaluated via minimum free energy (MFE) which was calculated as described (6).
Statistical analysis
All the statistical description and verification were done by R i386 3.0.2. We used t-test with 95% reliability in the testing of the data obtained.
Results
HEG and Non-HEG
From HEG-DB we have gained 253 HEG in E. coli K12.
Genome of E. coli str.K-12 substr.W3110 was obtained from the NCBI database to gather all the gene names and their corresponding sequences. After preprocessing, we gained 4206 genes in total. 3953 genes of non-HEG were obtained by eliminating 253 HEG from this data.
Criteria analysis
Codon usage
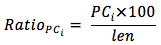
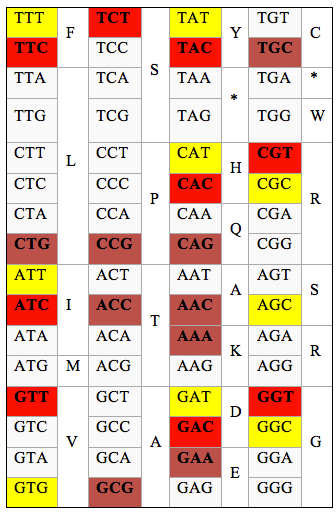
Through wc we found out the codon with the highest frequency for each amino acid. In principle, codons with high wc meant a high frequency of use, whereas low wc codon is a rare codon. We analyzed the similarity of the most preferred codon between the two groups of genes. As the result, only 9 of 18 codons with the highest wc are the same in HEG and non-HEG (Table 1). This means there is a difference, at 50%, in list of favor codons in the two groups. Furthermore, for each amino acid, frequency of favor codon in HEG is dramatically higher than those of rare codons while the difference of frequencies of two kinds of codons in non-HEG is low (Figure 1). For example, in amino acid R, in HEG, codon at position 5 is the highest priority, the codon at position 6 was only 0.5, 4 remaining codon with wc nearly 0. While in Non-HEG, there are two codons (position 4 and 6) are used with wc close to 1.
Table 1. The favor codons in HEG and non-HEG. Yellow box is the highest codon used in Non-HEG for each amino acid, red cells are ones in HEG. Orange is high codon used in both.
GC content (%GC)
GC content contributes to bond strength between two DNA strands as well as the formation of mRNA secondary structures. Thereby it critically affects the level of gene expression (7). Each species has a desired GC content, which approximates to 51 percent in E. coli (8).
Figure 2A showed the statistic of %GC in two groups HEG and non-HEG. The ranges of %GC, which defined from Q1 (25%) to Q3 (75%) in HEG is between 0.404 and 0.581, while non-HEG in the range from 0.268 to 0.667 (Figure 2A). In addition, the noise value at HEG also is negligible when compared with Non-HEG. This result proved that the GC content of HEG keeps strictly to the mean value. Results from t-test (P_value = 2.005 x 10⁻⁹< 0.05) showed that the average GC content of HEG (0.521) larger than the average value of GC content of non-HEG (0.511).
Shine Dalgarno (SD)
The Shine-Dalgarno (SD) sequence is a ribosomal binding site in prokaryotic messenger RNA, generally located around 8 bases upstream of the start codon AUG (9). This RNA sequence helps recruit ribosome to the mRNA to initiate protein synthesis by aligning the ribosome with the start codon. However, the occurrence of this motif within the coding region reduced the efficiency of gene expression due to slowing down ribosome slipping. To assess this criterion, we analyze the number of homologous sequences to the consensus sequence of SD (AGGAGG) with different degrees of similarity (from 4 to 6 matches - corresponding to the mismatch from 0 to 2) on each gene of HEG and non-HEG set.
Results from t-test showed that the frequencies of occurrence of sequences homologized to the SD consensus sequence of non-HEG were higher than in HEG in case of mismatch 0 and 1 (P-value less than 0.05). With 2 mismatches, the result from two groups was equivalent (Figure 2B). This proves that the appearance of the sequence homologized to the SD consensus on the mismatch 0 and 1 has greatly negative effect on the ability of gene expression.
Figure 1. wc of 59 codons of HEG and Non-HEG. The x-axis is in the order of 59 codons (Except 3 stop codon, 1 Trp codon and 1 start codon). Y axis is wc value. HEG always have the priority use for a specific codon.
Hidden stop codons (HSCs)
HSCs are stop codons (TAA, TAG, and TGA) that appear in the second and third reading frames of a protein-coding gene. Recent studies reported biological evidences which suggested that HSCs are important in preventing misread of mRNA, which is often detrimental to the cell (7). HSCs would save energy and other resources for the cell by terminating protein synthesis from frame shift translation.
In theory, the frequency of HSC in HEG will always be greater than in Non-HEG. According to statistics, frequency of HSC in frame 3 of HEG is above Non-HEG (P-value is 6.249 x 10⁻¹¹) while in frame 2, HSC of two groups are the same (P-value is 1) (Figure 2C). This can be explained by the mechanism of ribosomal frame shift mutation from frame 1 to frame 2 and from frame 1 to frame 3 are different (10). Each species tends to frame shift mutations in a certain frame, so the appearance of HSC will be concentrated in a certain frame. In this result, frame 3 is concentrated in E. coli.
Repeated sequences (RS)
Repeated sequences (Repetitive elements or repeats) are patterns of nucleic acids (DNA or RNA) that occur in multiple copies throughout the genome. RS appears on genes often causes instability on mRNA structure such as deletion mutations or reverse mutations. This causes negative effect to the abilities of genes to express complete proteins.
The result of analyzing on RS of HEG and non-HEG was showed in Figure 2D and 2E. The statistic results showed that the frequencies of RS in HEG is higher those in Non-HEG in all case (P-value less than 0.05). This is not compatible with theory that HEG must be more stable than Non-HEG for unknown reason. We suggest carrying out more experiments to have a deeper explanation in this criterion.
Polynucleotide (PN)
PN is the continuously repeat of single nucleotide on sequence of DNA. The existence of this motif could cause the linkage between two DNA strands to be weak (poly-A/T) or strong (poly-G/C) and affects the transcription and translation efficiency.
As the result, PN in non-HEG is more than in HEG in times of occurrence with the length of PN from 4 to 7 (Figure 2F). The longest PN is 7 nucleotide in HEG and 10 in non-HEG (data not showed). This can be explained by the negative effect of PN to expression level of genes as theory.
Polycodon (PC)
Similarly with PN, PC is a motif that a single codon is repeated continuously on the DNA coding sequence. When a ribosome slips to this motif in a translation process, many tRNA with the same kind will be required. This will slow down the translation due to using up the tRNA abundant in the cell.
As the result, the existence of PC was limited in both HEG and non-HEG with the length is 3 codons and above (Figure 2G).
mRNA secondary structure (SS)
According to recent studies, the limitation of SS in the first 7-10 codons of mRNA can increase translation efficiency (11). So we evaluated the formation of SS in the first 10 codons of mRNA via considering the minimum free energy (MFE). The durability of secondary structure is determined by the amount of MFE. It means a sequence with lower free energy will form secondary structures easier than another. Here we compared the average MFE in the first 10 codons and the next 10 codons to verify that hypothesis and find out the difference in ability in forming SS between HEG and non-HEG.
The statistical results showed that MFE of the first 10 codons in HEG were larger (getting closer to 0) than in non-HEG (P-value is 0.01). It reflected that there was a limitation in the formation of secondary structure in the first 10 codon of mRNA. The results of MFE in the next 10 codons of HEG, as expected, are equivalent to those in Non-HEG (Figure 2H). This emphasized the importance of SS in the first 10 codons of mRNA.
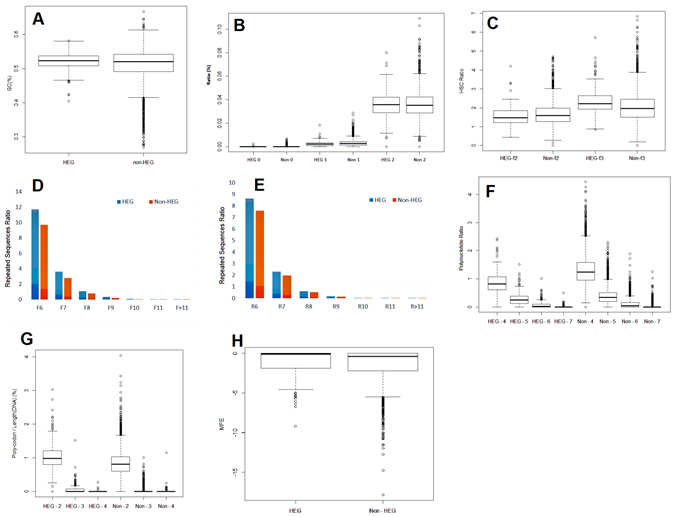
Figure 2. A. GC% average of HEG and non-HEG. The range of %GC in HEG is narrower than in non-HEG. In addition, the noise value at HEG also is negligible when compared with non-HEG. B. The ratio of sequences homologized to Shine-Dalgarno. The frequency of occurrence of sequences homologized to the SD consensus sequence of Non-HEG higher than in HEG in case of mismatch 0 and 1. With 2 mismatches, the result from 2 groups is equivalent. C. The frequency of HSC in HEG and Non-HEG. Frequency of HSC in HEG frame 3 improved markedly than in Non-HEG, while it’s the same in frame 2. Emphasizing the role of HSC on frame 3 in gene expression. D Frequency of forward RS in HEG and non-HEG. E Frequency of reverse RS in HEG and non-HEG. Both forward and reverse RS in HEG are appear more frequently than in non-HEG for unknown reason F Analysis of frequency of PN in HEG and Non-HEG. Frequency of PN in HEG is always lower than in Non-HEG in all 4 levels of repeatability. G Frequency of PC in HEG and non-HEG. Both frequencies in HEG and non-HEG is limited when length of PC exceed 2 codons. H MFE in first 10 codons. MFE of the first 10 codons in HEG are larger (getting closer to 0) than in non-HEG. It reflect that there is a limitation in the formation of secondary structure in the first 10 codon of mRNA
Conclusions
The results showed that there are differences between non-HEG and HEG in criteria that are analyzed. The differences in frequencies of favor codons and rare codons in HEG are much higher than those in Non-HEG. GC contents of HEG are also more stable than those of Non-HEG.
The structures that destabilize the mRNA decrease transcription and translation efficiencies such as Shine-Dalgarno sequences, Polynucleotide, Polycodon, repeated sequences and mRNA secondary structures are restrained at low frequencies. The statistic analysis of HSC also proved the tendency of shift frame translation in frame 3 of E. coli. From these results, researchers can develop ways to optimize gene base on all criteria that affect gene expression.


Add new comment