Thanh Nguyen1,†, Junjie Chen2,†, Dongxiang Ji2, Xiaoru Sun2, Chuandi Pan3,*, Chengshui Chen2,*, and Jake Y. Chen4,5,1,*
Abstract
In this work, we introduce a new framework to model the associations among clinical information in electronic health record. This framework integrates machine learning and network analysis to overcome three issues of electronic health record data: missing value, imbalance and non-uniform annotation, and increase the robustness of ‘marker’ clinical information discovery. We applied this method to study lung cancer data, collected by Wenzhou Medical University First Affiliate Hospital. Not only we constructed three networks among measurements but also we found Thyroglobulin could be a novel ‘marker’ clinical measurement and. Our findings could be validated at genomic level.
Introduction
Although electronic health record (EHR) has been increasingly studied for better preventive health system in recent years, efforts in predictive machine-learning based clinical modelling have not been thoroughly explored (1). EHR data has three specific issues, which increases the false positive discovery. First, EHR data contains missing values (2). Second, EHR data is naturally imbalanced: the probability of ‘abnormality’ events is often small. Third, EHR data lacks thorough and uniform annotation (3). In this work, we introduce a machine-learning based framework to discover the association among clinical information in EHR data. We carefully preprocessed the data and used random sampling to avoid 3 issues of EHR. By network analysis, we can suggest ‘marker’ clinical measurements for specific cohorts. We applied this framework to study lung cancer at Wenzhou Medical University First Affiliate Hospital, a representative data source for Southern Chinese population. The results show that our discovery clinical discovery result could be validated at genomic level. Therefore, this framework could be applied in identifying new lung cancer related genes in the future.
Methods
Acquire and preprocess data
The data use in this study contains clinical information from 8456 healthy people and 3397 lung cancer patients at Wenzhou Medical University First Affiliate Hospital, Wenzhou, Zhejiang, China between 2010 and 2012. There are 855 numerical measurements in this dataset. We selected measurements taken by at least 30 healthy people and at least 30 lung cancer patients to ensure statistical significance. After filtering, we only used 113 measurements for analysis. We applied z-score normalization because after z-score normalization removes all of the measurement bias in machine learning. We categorized data entries into ‘low’, ‘normal’ and ‘high’ classes by comparing the measurement values and its default normal minimum and default normal maximum.
Construct machine-learning-based (ML) measurement networks
We used support vector linear regression (SVLR) (4) to discover the association among clinical measurements in three scenarios: using both healthy people and lung cancer patients data (MLHL), using healthy people data (MLH) and using lung cancer patients data (MLL). We used ILOG CPLEX Optimizer (5) for implementation. Because entries in the dataset can be labeled by 3 classes and the entries from the same measurement do not have the uniform thresholds for labeling, standard classification/regression techniques may be susceptible to error. Here, we applied under-resampling method in (6) to select the balanced subset such that each class have equal number of samples to train the SVLR models. For each targeted measurement i, the SVLR returns the correlation vector wi, which could be used to interpret the impacts from other measurements j in the feature space on i. Therefore, we selected |wji| to as the correlation strength from measurement j to measurement i. We discarded associations with |wji| < 0.01 to cut off noise. On the non-zero w list, we used the highest 10% |wji| to construct the correlation network among measurements.
After constructing the networks for 3 scenarios above, we calculated the node degree of each measurement in each network and rank the measurement based on its degree. To evaluate the significance of each measurement in all 3 networks, we sum up all ranks of the measurement in 3 networks (SR score). To evaluate the specificity of each measurement in 3 networks, we sum up the pairwise rank difference of the measurement (PR score).
Validate the ML networks by genomic association
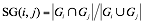
We used OMIM (7), a manually curated gene-phenotype term association database, to find genes associating with the measurements. We found 4682 measurement-gene association from 79 measurements and 1911 genes. Let i, j be the indexes of measurement and Gi, Gj be gene set associated to measurement i and j correspondingly. We defined the share gene (SG) score for each measurement-measurement association as


Results
Measurement ML networks and hub characteristics
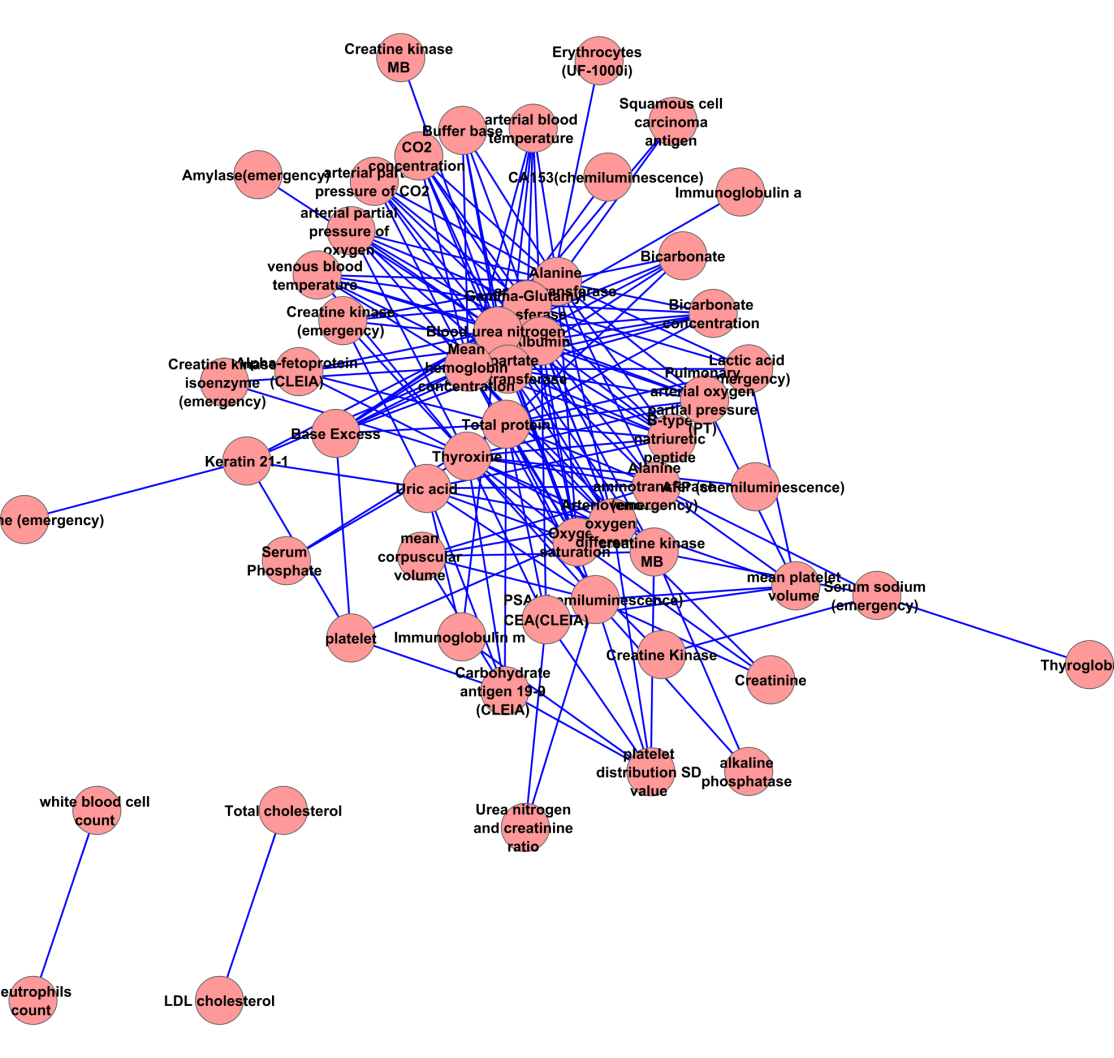
We acquire 3 ML networks with different power-law characteristic as follow. The MLHL network contains 303 associations from 87 measurements (Supplemental figure 1). The in-degree of MLHL network show moderate power law (correlation: 0.976, R-square: 0.784); meanwhile, its out-degree shows strong power law (correlation: 0.878, R-square: 0.725). The MLL network (Supplemental figure 2) contains 233 associations from 63 measurements. Unlike the MLHL network, the power law is not applicable in neither in-degree (correlation: 0.521, R-square: 0.304) nor out-degree (correlation: 0.602, R-square: 0.447) in the MLL network. The in-degree The MLH network (supplemental figure 3) contains 179 associations from 55 measurements. Similar to the MHL network, the power law is not applicable in neither in-degree (correlation: 0.767, R-square: 0.345) nor out-degree (correlation: 0.222, R-square: 0.060) in the MLH network. These facts suggest the probability of ‘marker’ measurement in healthy and lung cancer analysis: the ‘marker’ measurements are more likely to appear to classify healthy people versus lung cancer patients; meanwhile, the ‘marker’ measurements are less likely to appear to classify subtypes in lung cancer.
Table 1 shows the top 5 measurements on the SR score (see Method section 2) over 3 networks. Carbohydrate antigen 19-9 (CLEIA) and Alpha-fetoprotein (CLEIA) appear at the top of the list. This result is reasonable since Carbohydrate antigen 19-9 and Alpha-fetoprotein have been known as tumor markers (8). Thyroglobulin and creatine kinase MB could be novel measurements associating with lung cancer due to the low (<= 5) supporting evidences by querying “(lung cancer [Title]) AND <measurement name>[Title/Abstract]” on PubMed.
Table 1: Top 5 measurements having highest SR score
|
Measurement Name
|
MLHL degree
|
MLH degree
|
MLL degree
|
SR
|
|---|---|---|---|---|
|
Carbohydrate antigen 19-9 (CLEIA)
|
23
|
6
|
22
|
51
|
|
Alpha-fetoprotein (CLEIA)
|
16
|
4
|
25
|
45
|
|
Thyroglobulin
|
33
|
1
|
10
|
44
|
|
Creatine kinase MB
|
20
|
8
|
16
|
44
|
|
Arteriovenous oxygen difference
|
18
|
17
|
8
|
43
|
We observe the well-known measurement Alpha-fetoprotein (CLEIA) and the potentially novel measurement Thyroglobulin on the top 5 measurements on the PR score (see method section).
Table 2: Top 5 measurements having highest PR score
|
Measurement ID
|
MLHL deg
|
MLH deg
|
MLL deg
|
PR
|
|---|---|---|---|---|
|
Thyroglobulin
|
33
|
1
|
10
|
64
|
|
Indirect bilirubin
|
30
|
0
|
0
|
60
|
|
Alpha-fetoprotein (CLEIA)
|
16
|
4
|
25
|
42
|
|
Monocyte count
|
19
|
0
|
20
|
40
|
|
Serum chloride
|
13
|
0
|
20
|
40
|
The MLHL network show strong genomic association
We observe that the MLHL network could be explained by share gene argument; especially the ‘hub genes’ could well-explain the novel measurement-measurement association mentioned in section II.3. In Figure 1, we observe the significant difference between SG scores of measurements directly linked work (1 step) and the SG scores of these linked by two edges (2 step) and three edges (3 step). The SG scores in MLL and MLH network is insignificant.
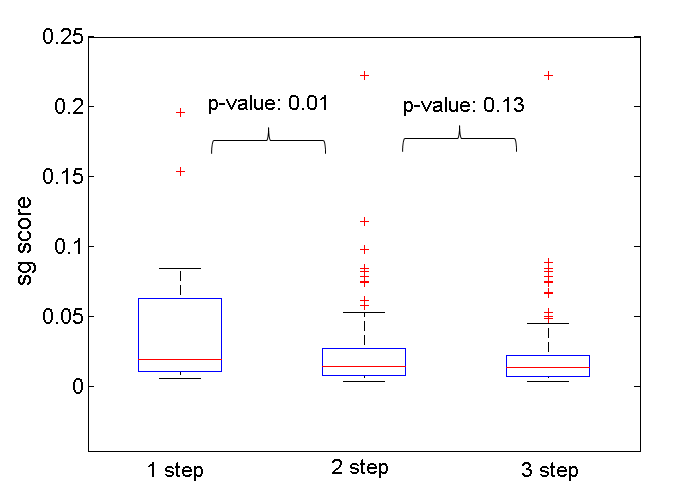
Fig. 1. Distribution of SG score on MLHL network, group by step neighborhood. The p-value is calculated from Wilcoxon Ranksum test.
We also found genomic evidence linking Thyroglobulin, one of the top measurements in all 3 ML networks, and lung cancer. SLC2A1, the top gene associated to Thyroglobulin, is statistically associated with glucose-uptake in patients with the squamous cell type of non-small-cell lung cancer (9). HMGCR, the third hub-gene associated with Thyroglobulin, is an upstream regulator of STAT6, which induces ER stress-mediated apoptosis in lung cancer cells (10).
Discussions
In this work, we show that an integrated machine learning – network analysis framework could take the advantage of the rich and precise clinical information in EHR data to study diseases from a new perspective: modelling clinical information. In addition, we show that the ‘marker’ clinical information may be different when applied to different cohorts. Therefore, this work could potentially contribute to both personalized risk management and personalized ‘marker’ gene identification.
References
Supplemental information
Figure S1: MLHL network
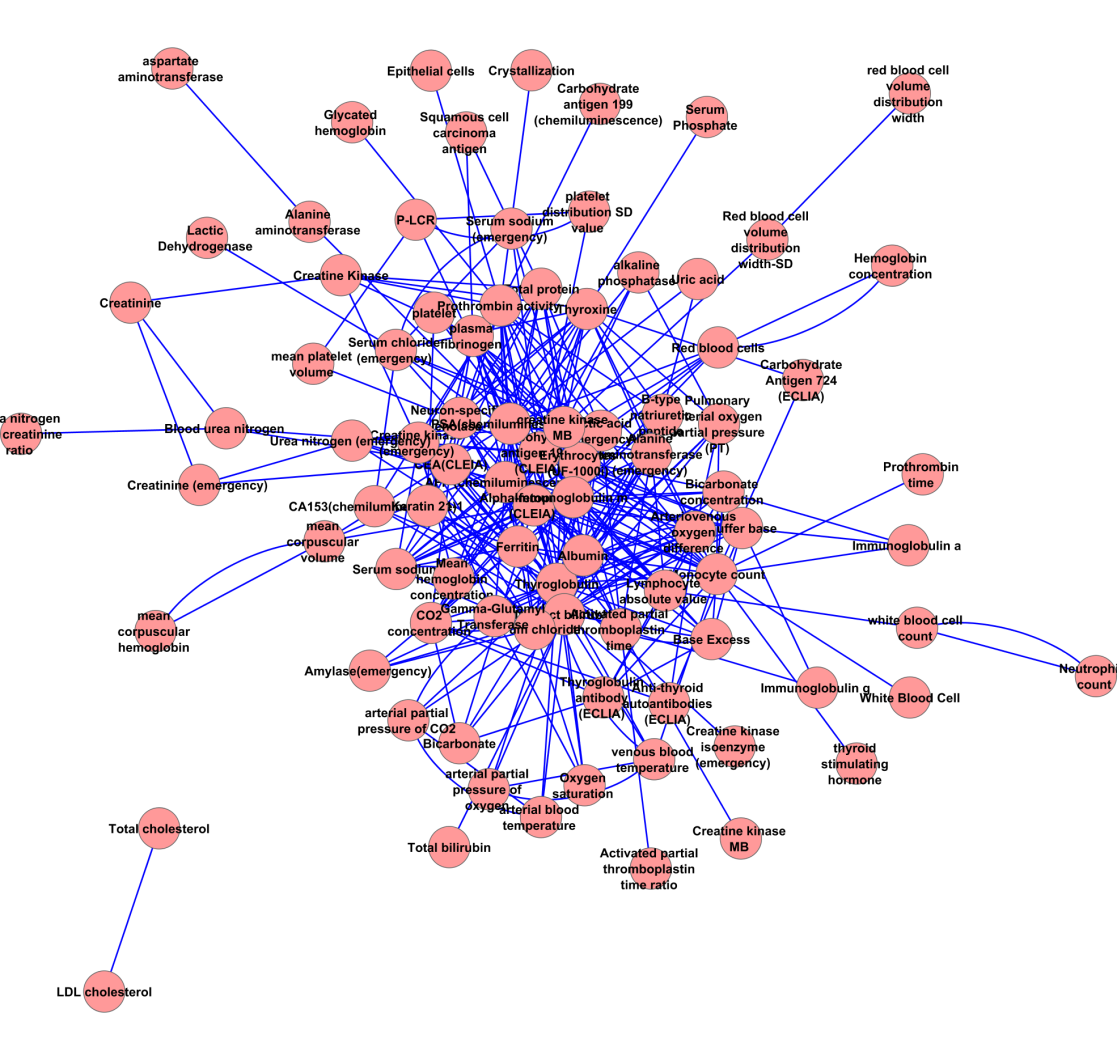
Figure S2: MLL network
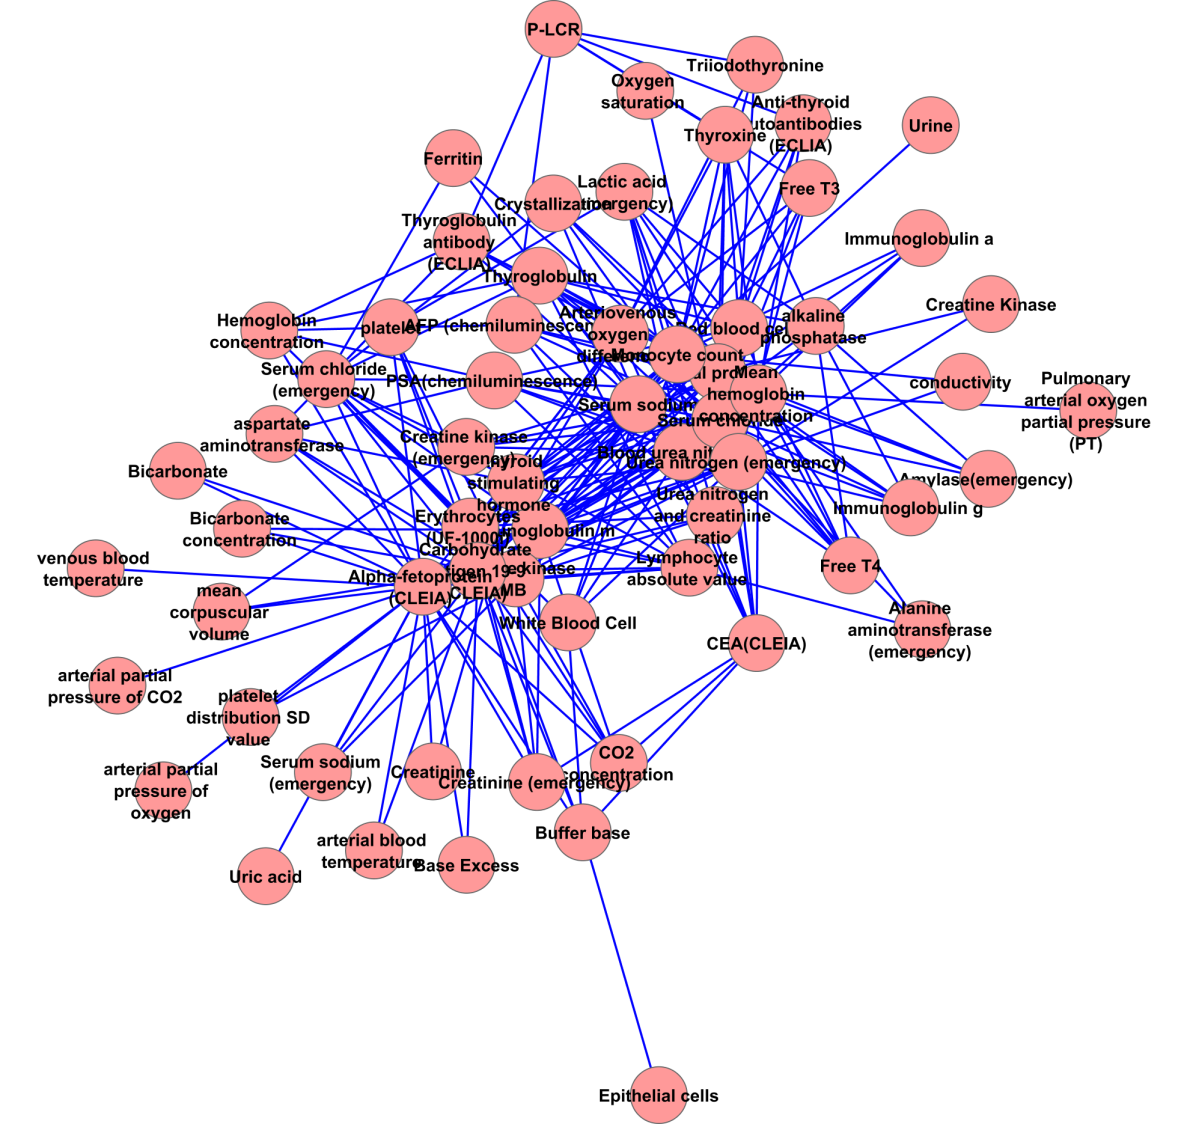
Figure S3: MLH network


Add new comment