Phuong Thi Huynh1, Giang Thanh Dien Nguyen1, and Hue Thi Nguyen2,*
Abstract
Breast cancer is the most common cancer in women over the world and is the fifth cause of death from cancer overall. Effected expression of some genes due to polymorphisms increases the risk of breast cancer incidence.Although there were many studies shown that the rs3817198 was significantly correlated with breast cancer risk in White and European population, this SNP has not been studied in Vietnamese population. Thus, in this research, a High Resolution Melting method was developed to screen the SNP in Vietnamese breast cancer patients. The PCR reactions were optimized at various conditions and the best parameters for HRM assay to genotype SNP rs3817198T>C was successfully determined, including Ta=64oC, 0.3µM each primer, 20ng of DNA and 2.5mM MgCl2. Then, HRM were run on 107 DNA samples extracted from fresh blood for preliminary estimation of genotypes frequencies. Three genotypes were found with different frequencies, involving wild-type (TT), homozygous mutant (CC), and heterozygous mutant (TC) with 69%, 2%, and 29%, respectively. Likewise, the percentage of risk allele C was calculated to be 16.5%. This is primary estimation that will support for further association study to find out the suitable markers for diagnosis of breast cancer in Vietnamese.
Introduction
Breast cancer is a heterogeneous disease (1). It refers to a malignant tumor that has developed from cells in the breast. According to the Globocan project, breast cancer is the second most common cancer in the world and, by far, the most frequent cancer among women with an estimated 1.67 million new cancer cases diagnosed in 2012 (25% of all cancers). Breast cancer was also ranked as the fifth cause of death from cancer overall (522,000 deaths each year). Although origin of breast cancer are not fully known, researchers have identified a number of factors that increase the chances of getting breast cancer, both intrinsic factors (genetic factors) and extrinsic factors (environmental factors) (2). To family history factor, it is estimated that 5% to 10% of breast cancer cases result from inherited variants, including those in the breast cancer susceptibility genes BRCA1 and BRCA2 (3). Scientists believe that much of the occurrence of breast cancer in families results from the interaction between lifestyle factors and low-risk variations (4).
In Vietnam, Ministry of Health showed that there are about 15,000 new breast cancer cases annually. In which, 70 per cent of the cases are diagnosed when they are already in the final stages of the disease (5). This brings to the low survival rate. Besides, breast cancer typically produces no symptoms when the tumor is small. Therefore, it is essential to know what potential biomarkers for an early diagnosis are to improving life expectancy of women with breast cancer in Vietnam.
Recently, genome-wide association studies (GWAS) have identified several SNPs that are associated with breast cancer risks in White women (6), in which 8 SNPs (rs2046210, rs1219648, rs3817198, rs8051542, rs3803662, rs889312, rs10941679, and rs13281615) were concluded to be strongly associated with Asian population (10). In this study, SNP rs3817198 which is located on LSP1 (lymphocyte-specific protein 1), 11p15.5 of chromosome 11 will be focused due to many reasons. First and foremost, PubMed, Embase and Web of Science databases revealed that the LSP1 rs3817198T>C polymorphism was significantly correlated with breast cancer risks when all studies were pooled into the meta-analysis (the allele contrast model: OR = 1.06, 95% CI = 1.04–1.08; the homozygote codominant: OR = 1.14, 95% CI = 1.01–1.28) (7). Furthermore, LSP1 gene involves some processes in common with mammary gland development and involution that could contribute to fibrosis and, thus, mammographic density (8). Moreover, down regulation of LSP1 because of gene variation severely reduces phagocytic activity of macrophages (9). Consequently, diminishing of macrophages impairs the normal development of the mammary gland (10). Besides, the minor allele of the SNP rs3817198 (C allele) was also convinced in one study (11) to be associated with breast cancer susceptibility genesBRCA2 (hazard ratio (HR) = 1.16, 95% CI: 1.07–1.25, P-trend = 2.8 × 10⁻⁴). However, most of these studies were conducted in women of European descent, and the risk factors for hereditary have not been evaluated sufficiently for other populations, especially Vietnamese population.
Because of that, high resolution melting analysis (HRMA) method which is more reproducible and better accuracy either than denaturing high-performance liquid chromatography (dHPLC) and denaturing gradient gel electrophoresis (DGGE) will be developed to detect candidate SNP rs3817198T>C in 107 samples to initially estimate its frequency in Vietnamese breast cancer patients. In reality, several commercial molecular test kits are available to identify point mutations; however, the interpretation of these tests remained many drawbacks such as time-consuming and complex-procedure (12). Whereas, high-resolution melting (HRM) is a homogenous and closed-tube method that could minimizes the amount of manual handling and simply analyze the data.
Materials and methods
Samples
107 blood samples of diagnosed breast cancer (BC) patients in Vietnamese population, which were collected from Oncology hospital and keep in EDTA-containing falcon to prevent blood clotting. These tubes were inverted several times to ensure thorough mixing for proper anticoagulation. Then, treated samples were stored at -80oC for DNA extraction. The patients were also asked to fill in a consent form and the samples collecting process was approved by the Ethics Committee of HCMC Oncology Hospital.
DNA extraction
Genomic DNA was extracted out of 500µL of EDTA-blood samples following the modified salting-out method (13). The quality and quantity of DNA was assessed by using NanoDrop Spectrophotometer (Thermal Scientific NanoDrop), which the expected results were 1.7-2.0, and more than 40ng/µL, respectively.
Primer design
Primers were designed using Primer3Plus tool. At this stage, criteria for HRM product were also taken into consideration, especially PCR product size. Normally, the amplicon was made with the size ranging from 80-250bp so that the difference in only one nucleotide change can be identified easily. Potential primer pair was then quickly checked for specificity by the Basic Local Alignment Search Tool (BLAST) on the NCBI site (http://blast.ncbi.nlm.nih.gov/Blast.cgi) and UCSC-in-silico PCR for regions of similarity to ensure they are unique and specific for the genes of interest. Also, secondary structure were check on DINAMelt server with ∆G >-1.
Amplicon prediction
Normalized Melting curves of 3 kinds of genotypes were predicted by using uMelt HETS (https://www.dna.utah.edu/hets/umh.php) to provide the relatively visual separated position and melting domains. The prediction could be made based on unchanged factors setting such as DMSO, Mono+, Betaine while MgCl2 was adjusted to determine the best condition where the clearest discrimination between variations could be formed.
Optimization
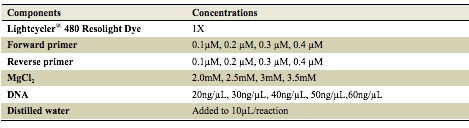
Firstly, optimal annealing temperature (Ta) was identified by running reactions under Ta gradient condition within the range from 60 to 72oC with 2oC increment. PCR product was then checked by performing 2.0% gel electrophoresis to visualize bands. Primer, DNA concentration, and MgCl2 were also optimized to assess whether they could be a critical parameters affecting HRM discrimination melting curve. Particularly, PCR reactions were prepared and run with various concentrations of each reagent, one reagent by one reagent, as demonstrated in the table 1.
Table 1. Components and concentrations of chemicals for PCR reaction.
High-resolution melting analysis
After obtaining the optimal conditions, the HRM assays were performed using the LightCycler 96 Real-time PCR System instrument. Firstly, PCR was run with 40 cycles, including 95oC-30s, 64oC-15s, and 72oC-30s. Then, HRM was performed immediately with the temperature ranging from 65o-95o. All 107 samples were genotyped. There were 20 samples, three positive, and one negative control included in each experiment. Results were then analyzed using fluorescence versus temperature graphs which were generated by Light Cycler® 96 Application Software Version 1.1.
Results
Primer design
Two set of primers were designed including one pair for HRM assay and the other for sequencing (table 2). This is because it is necessary to confirm genotypes of 3 samples which were firstly predicted with different genotypes by HRM method so that later, they can be used as control samples.
Table 2. Detail information of the HRM primers.
|
Primers
|
Sequences
|
Tm
|
Size
|
Amplicon
|
|---|---|---|---|---|
|
Forward-HRM
|
5’-GCTCAGTCTCCCAGTCCTGTGC-3’
|
65.9
|
22
|
94bp
|
|
Reverse-HRM
|
5’-GCTGAGCCGGGCTGACTCTA-3’
|
65.3
|
20
|
|
|
Forward-SEQ
|
5’-AGTCCCTGGCAACTCACAGA-3’
|
60.9
|
20
|
350bp
|
|
Reverse-SEQ
|
5’-CACCTGCTTCCTTCAATGCTA-3’
|
60.4
|
21
|
Initial PCR and HRM optimization
Annealing temperature
Figure 1A showed the results of optimizing annealing temperature (Ta) for HRM primer that all the bands had quite similar brightness. However, at Ta equal to 64oC, the Ct value was lowest (Ct=23.53) and the plateau was highest (Figure 1B). This means the amplification performed perfectly within wide range of 60-72oC Ta, but the best one was 64oC. In addition, there were no primer-dimer or by products formation that strongly supported for success of primer design.
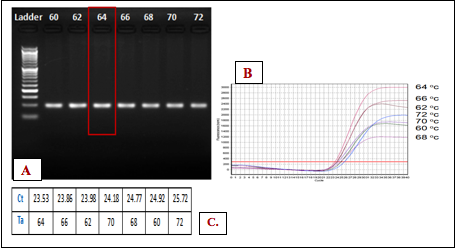
Figure 1. Identifying optimal Ta for PCR: A. Gel electrophoresis of gradient Ta, B. Amplification curves, C. Ct value of melting curve for each Ta.
Primer concentration
Within the range between 0.1 µM and 0.4 µM, there was no PCR product at 0.1µM concentration while at higher concentration the brighter bands of DNA were observed (Figure 2A). In this case, 0.3 µM primer was chosen to save the reagent even though 0.4 µM is brighter. It is reasonable because the Ct value of two this concentration is not significantly different and the plateau height is almost similar (Figure 2B and 2C).
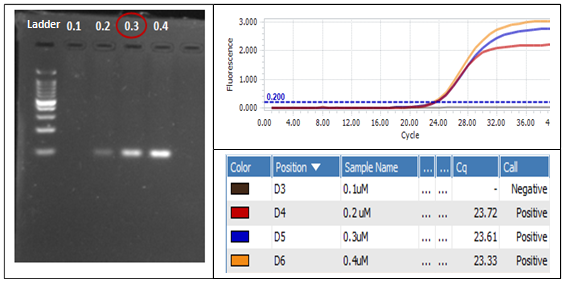
Figure 2. Affecting of various primer concentration on PCR outcome: A. Gel electrophoresis, B. Amplification Curves, C. Ct value at each primer concentration.
DNA concentration
20, 30, 40, 50, and 60ng genomic DNA were used as a template for PCR reaction. Slight differences in amplification yield (Figure 3A and B) did not affect melting profiles or allelic discrimination (Figure 3C) at any concentration from 20ng to 60ng. Therefore, the amount of 20ng DNA was chosen as standard input for HRM assays so that valuable genetic material could not be waste.
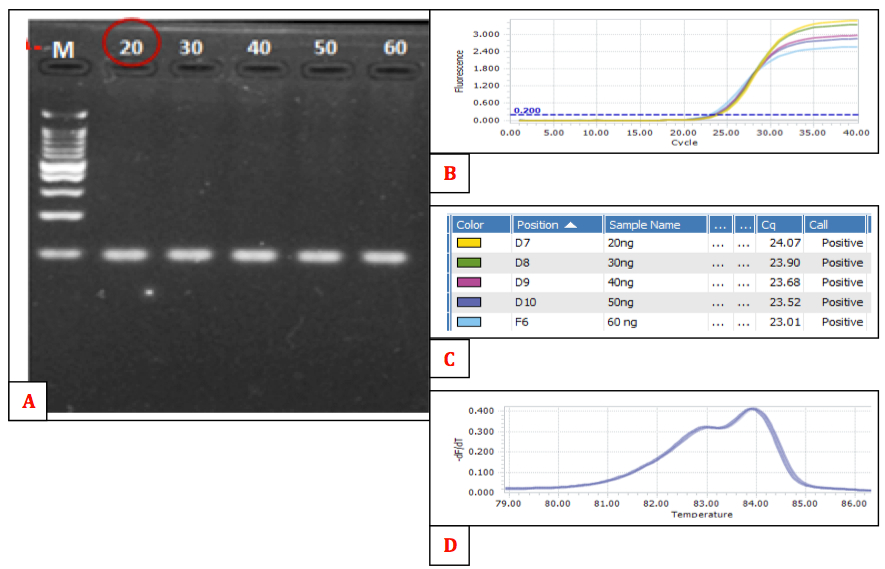
Figure 3. Affecting of various DNA concentration on HRM outcome: A. Gel electrophoresis: all the bands have similar brightness and thickness, B. Amplification curves, C. Ct value of 5 concentrations is not different significantly, D. Normalized melting peaks which are clustered into only one group even though various DNA concentration input.
MgCl2 concentration
As prediction by uMelt HETS, increasing MgCl2 concentration made discrimination of 3 genotypes is clearer. When performing MgCl2 optimization the result shown that the more MgCl2 were in reaction, the higher PCR product was produced (Figure 4). We, therefore, chose 3mM MgCl2 where yields the brightest band (Figure 4A) and lowest Ct value (Figure 4B) as an ideal condition for HRM performance.
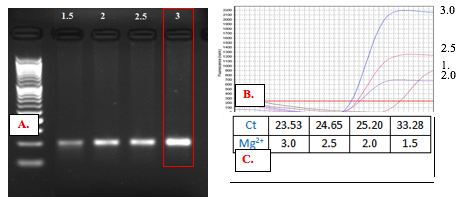
Figure 4. PCR product from variant MgCl2 concentration: A. Gel electrophoresis, B. Amplification curves, C. Ct value at each MgCl2 concentration
Identifying the control samples
To increase the reliability of HRM method, 3 positive control samples which is known genotypes should be always included in each assay performance. Thus, after performing the initial optimization of HRM conditions, 8 randomly samples were screened to identify 3 control genotypes: wild-type (TT), homozygous mutant (CC), and heterozygous mutant (TC). The result showed that there were three groups of genotypes (Figure 5). Hence, one sample for each group was selected to sequence for confirming the genotypes.
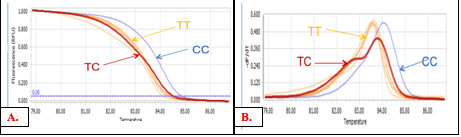
Figure 5. Screening for control samples: A. Normalized melting curves, B. Normalized melting peaks
The sequencing data were analyzed by SeqScape v.2.5 (Applied Biosystems). As can be seen from Figure 6, peaks are sharp, well defined, and there is no background interference at the baselines. Therefore, nucleotide reading was easy to reach accuracy with even manually.
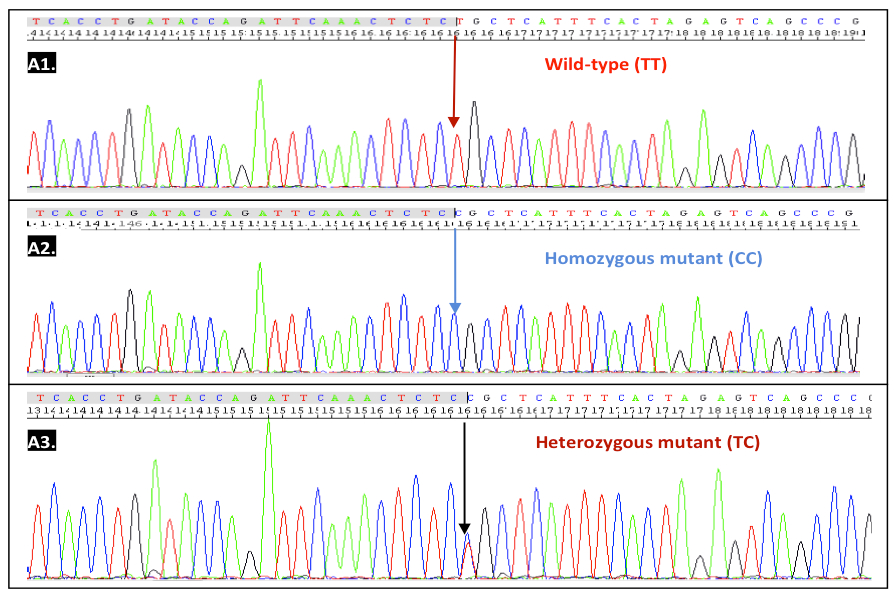
Figure 6. Chromatogram of 3 different genotypes by Sanger sequencing: A1. Wild-type (TT), A2. Homozygous mutant (CC), A3. Heterozygous mutant (TC).
HRM optimizing
We applied the initial optimal PCR-HRM conditions which were optimized previously to screen control samples. As can be seen in Figure 5, homozygous wild type (TT) seemly did not cluster perfectly together. This can be because the initial optimal condition may be not really ideal for HRM analysis. In which, according uMelt HETS prediction; MgCl2 concentration has notable effects on HRM melting curve. Therefore, MgCl2 concentration was optimized again on 3 identified control samples. Four concentration of MgCl2 from 2mM to 3,5mM have been used.
At 2.0 and 3.5mM MgCl2, the heterozygous genotype is nearly overlapped with homozygous wild-type instead of crossing at middle (Figure 7-A1 and A4). This may lead to missed calling these 2 genotypes when analyzing many samples. Whereas, the discrimination of 3 genotypes was clearest in all type of curves at both the 2.5 and 3.0mM concentration (Figure 7- 2 and 3). However, the higher MgCl2 concentration may generate undesired PCR product then yield unclear result like previous HRM analysis for screening the controls (Figure 5). Hence, 2.5 mM MgCl2 was applied for further HRM analysis.
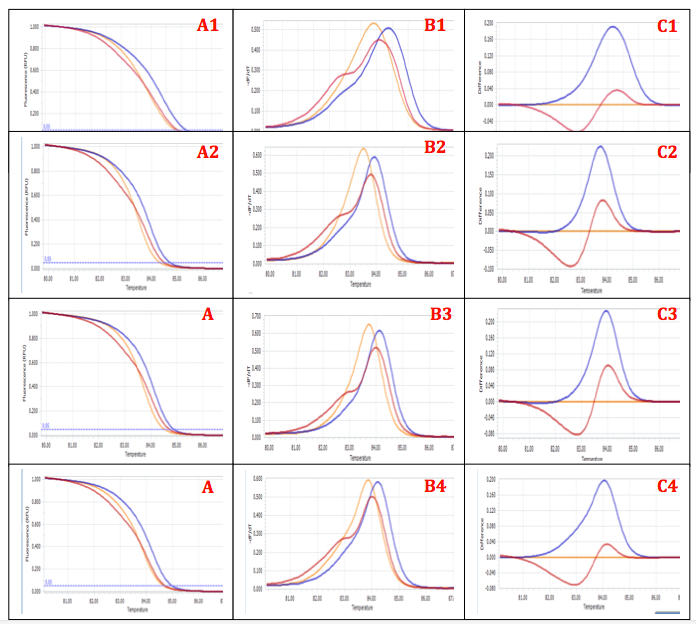
Figure 7. Affecting of MgCl2 concentration on discrimination of 3 genotypes:
A. Normalized Melting Curves, B. Normalized Melting Peaks C. Difference Plot.
MgCl2 concentration: 1=2.0mM, 2=2.5mM, 3=3.0mM, 4=3.5mM.
Genotyping
For each run, after real time PCR amplification, a melting step was performed in the presence of a DNA binding saturation dye. The software automatically clustered similar curve shapes into one group representing identical genotypes
Genotypes for SNP rs3817198 T>C were successfully discriminated by the HRM method. Almost samples were able to be classified accordingly based on the melting curve shape in three way of analysis: Normalized melting curve (Figure 8A) and normalized melting peak (Figure 8B) and difference plot (Figure 8C). Indeed, heterozygous samples were easily detected by changes of curve shape because of the greater destabilization of the two mismatches of the heteroduplexes. In Figure 8, the wild type (TT) produced a similar curve as the homozygous mutant (CC), but with a lower melting temperature (Tm).
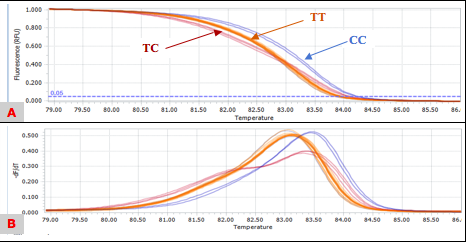
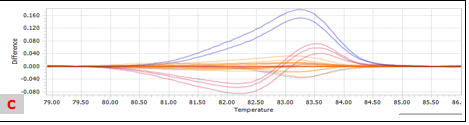
Figure 8. Three different genotypes in various types of curves A. Normalized Melting Curves; B. Normalized Melting Peaks; C. Difference Plot.
Besides successful outcome, 7 samples have been failed in identifying the genotypes because they did not cluster into any control group (Figure 9)
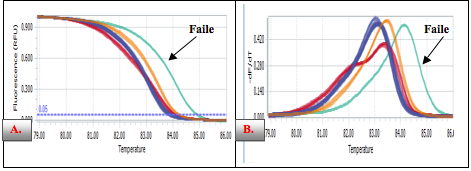
Figure 9. Failed genotyping calling samples A. Normalized melting peaks, B. Normalized melting curve.
Within 100 successful genotyping samples, the allele T of SNP rs3817198 is the dominant allele in Vietnamese breast cancer patients (83.5%) while the allele C is a recessive allele (16.5%). Although C allele is less common than T allele, it is variant that correspond to the disease. In case of genotypes, frequencies of SNP rs3817198 are shown in table 3. While the frequency stands at 69% for homozygous wild-type, it is 29 and 2%.for the heterozygote TC and the homozygous variant CC, respectively.
Table 3. Genotype frequencies of LSP1 rs3817198T>C polymorphism
|
|
n=107
|
|||||
|
Genotypes
|
Alleles
|
Failed samples
|
||||
|
TT
|
TC
|
CC
|
T
|
C
|
||
|
Number of samples
|
69
|
29
|
2
|
167
|
33
|
7
|
|
Frequency (%)
|
69
|
29
|
2
|
83.5
|
16.5
|
6.5
|
Discussion
Several techniques are available for SNP-genotyping that is suitable for high throughput screening such as denaturing gradient gel electrophoresis (DGGE), denaturing high performance liquid chromatography (DHPLC), exonuclease (TaqMan probe) (14). All of these methods require separation of the sample on a gel or other matrix whereas high resolution melting analysis offers a closed-tube assay without the need for any post-PCR processing. Moreover, the use of a single instrument also minimizes the amount of manual handling, which improves turnaround times. These characteristics make HRM an attractive choice for the detection of disease-associated variants with applications in clinical diagnostic labs. Especially, HRM could be a suitable initial clinical screening tool for resource underprivileged countries like Vietnam.
To develop a successful HRM assay for detection LSP1 rs3817198T>C polymorphism or any other point mutation, characteristics such as DNA quality, amplicon size, MgCl2 concentration should be consider carefully. Because if DNA quality (salt carryover and other experimental artifacts) is not controlled properly, it can complicate the interpretation of DNA melt curves, leading to lower reproducibility and higher error rates in HRM variant calling. In contrast, DNA concentration did not significantly affect melting profiles or allelic discrimination (Figure 3). However, standardization of DNA input is also important to obtain the best HRM analysis result. Because if DNA input are too various, melting curves of the same genotype may shift far away from each other and then potentially lead to misclassification of genotypes (15). Secondly, the size of amplicons could explain the differences between the expected and observed results. In fact, HRM of small amplicon improves different genotypes discrimination because Tm differences between genotypes are greater than in larger amplicon (16). Primer designer therefore should focus on generating the smallest amplicon as possible to obtain the greatest discrimination between melting curves. Thirdly, the marked effect on melting curves was observed with Mg2+. As the MgCl2 concentration was increased, the HRM melting curve changed distinctively. However, too high MgCl2 concentration may generate undesired PCR products.
Another point which is worth mentioning is that there were 6.5% of samples which did not cluster into any control group with even a good quality HRM assay. One of the reasons is that the amplicon may contain other SNPs than the target one. Although these SNPs are very rare (MAF<0.0004, NCBI), they could still affect the melting profile if occurred. Another reason may be the significantly difference in DNA quality between samples. In particular, low quality DNA may prevent samples from reaching high plateau and change the melting temperature (Tm). Despite having these limitations, genotypes calling are still accurate thanks to 3 control genotypes which are always included in each experiment.
Last but not least, the frequency of risk allele (C) was low (16.5%) while normal allele (T) was high (83.5%). This result was also in agreement with Japanese, Chinese, and African population (8.93%, 16.2% (17),16.71% (18), respectively)whereas European population is roughly twice as high as Asian (33.03% (17)). This can be explained by the fact that allele frequencies of single nucleotide polymorphisms SNPs can vary by ethnic group. For that reason, it is still necessary to conduct studies with larger samples size as well as healthy controls to evaluate association of a LSP1 gene rs3817198T>C polymorphism with breast cancer risks in Vietnamese population.
Acknowledgement
This research is funded by Vietnam National Foundation for Science and Technology Development (NAFOSTED) under grant number 106-YS.01-2013.09.


Add new comment